How might we 01
Plan an intelligent visit tour
Order the day by patient priority, geolocation and an estimate of how long each visit takes — then support navigation between homes and the preparation of the medical material to bring along.
Healthcare · Service design · 2020
A digital platform to plan and coordinate home hospitalisation visits — replacing a paper notebook, a whiteboard and a lot of phone calls.
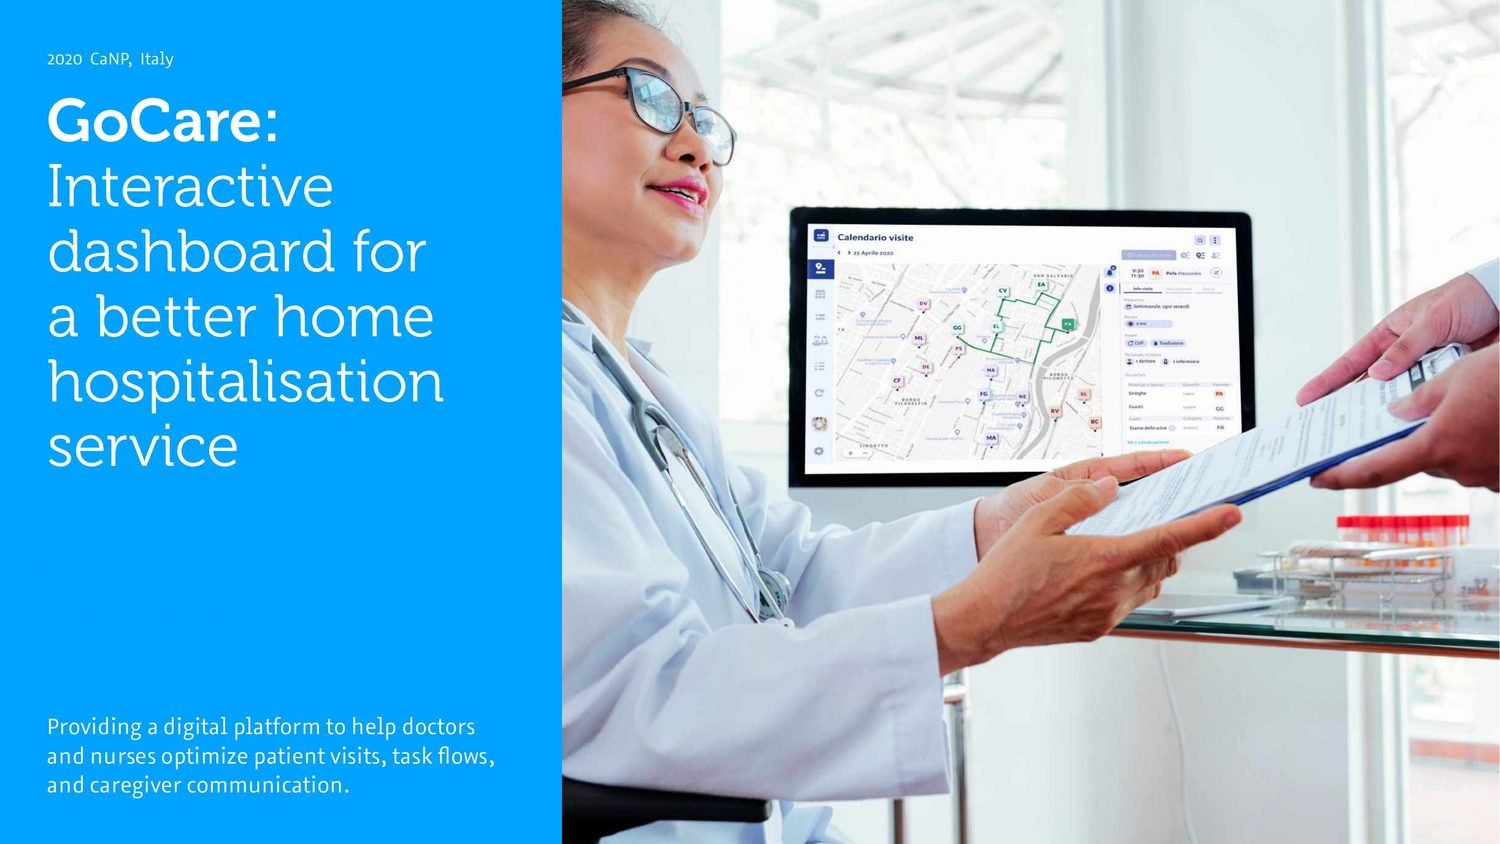
Home hospitalisation (ospedalizzazione a domicilio) is an alternative to a hospital bed for patients in the acute phase of an illness: doctors and nurses go to the patient's home instead. In Piedmont the service has been running since 1985 at the AO CSST, for patients with geriatric and metabolic bone diseases.
It works, and it runs on paper. Every morning the staff has to decide who visits whom, in what order, with which materials — while the patients' conditions keep changing overnight.
Interviews and task analysis in the OAD units of Molinette in Turin and Cresla in Novara surfaced three problems that fed each other:
The team's estimates put this at the order of one and a half to three hours a day, per unit, spent planning the visit tour and rewriting paper records — time taken directly from clinical work.
Four questions carried the project. They're worth reading as they were written, because each one is a constraint disguised as an opportunity.
How might we 01
Order the day by patient priority, geolocation and an estimate of how long each visit takes — then support navigation between homes and the preparation of the medical material to bring along.
How might we 02
A patient's complexity changes overnight, and with it the priority of the visit. The plan has to be re-made in minutes, not re-negotiated in a meeting.
How might we 03
Patient information has to be accessible and up to date for the whole OAD staff — both on a visit and back in the office.
How might we 04
Visit tours have to be organised around the real shifts of doctors and nurses, including who is specialised in what.
Understand
UX researchers ran interviews and task analysis inside the OAD units, producing insights, user requirements and a task analysis. In parallel, best practices from comparable services and platforms were reviewed.
Model
Pain points and opportunities were mapped, then turned into a concept: task flows, user journeys, a detailed service blueprint and a system map.
Design
Information architecture, hi-fi wireframes, a UI design system, and a click-through prototype iterated on expert feedback.
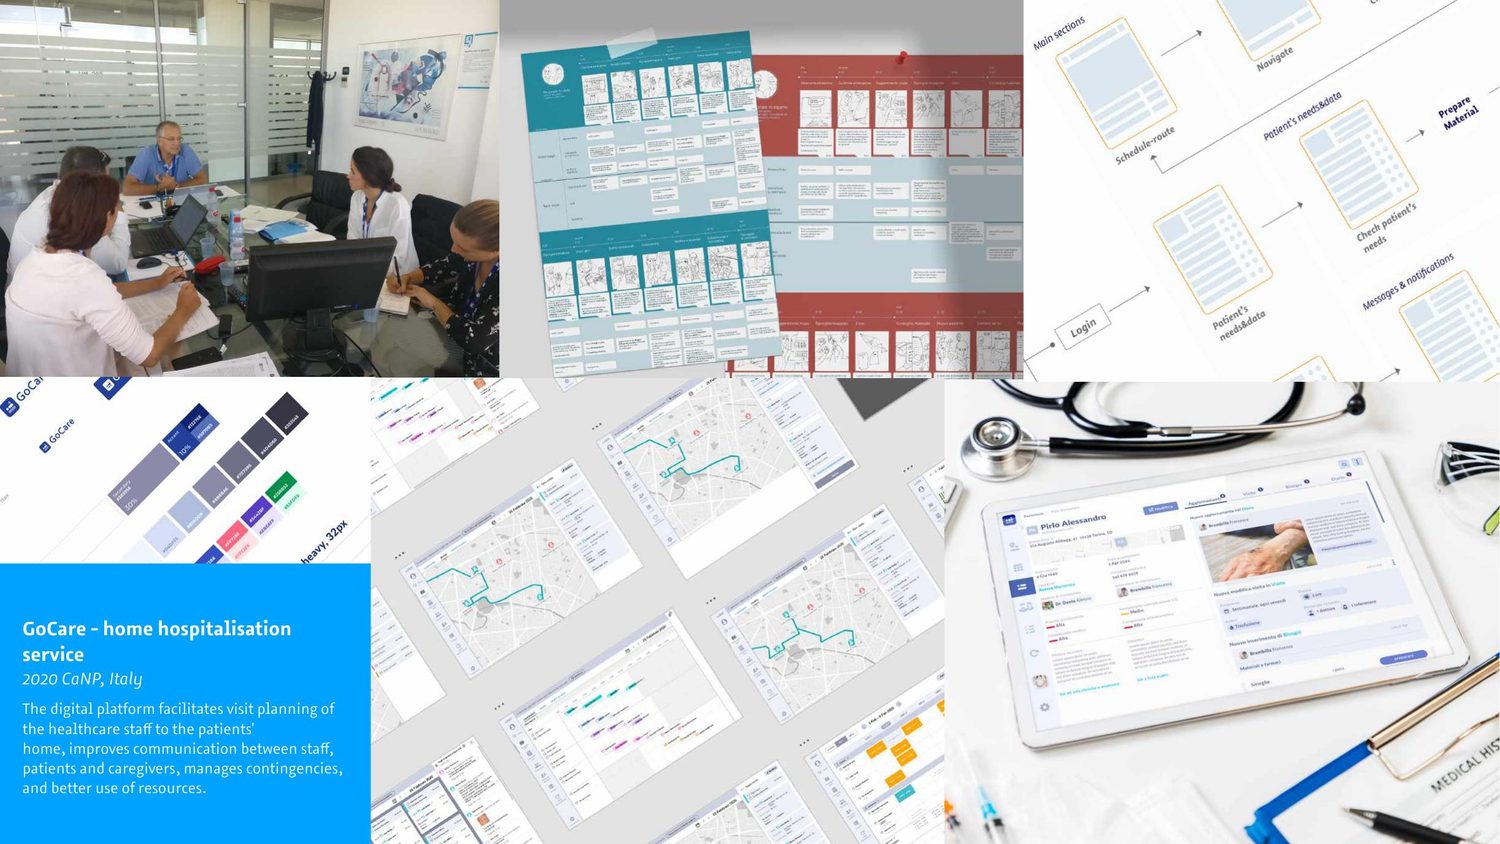
The journeys were built around two real shifts: Giovanni, the nurse on mornings, and Elena, on afternoons. Mapping their days hour by hour is what turned a generic "coordination problem" into a list of specific moments where a tool could help.
8:00 — arrival at the unit and preparation of the material, checking which events overnight have changed the plan: a death, a return home, an ambulance call, a fall. 8:30 — the tour is defined for the 9-to-12 window, weighing clinical needs, priority, patient location, who is on shift and continuity of care. 9:00 — departure with the paper records, exam results and materials. 9–12 — during the visits, needs and problems emerge, written on a pad. 12:30 — back at the unit, the pad is copied into the visit notebook. 13:00 — handover to the afternoon nurse, by voice.
Read like that, the opportunities are obvious: the handover becomes a shared record, the pad a diary updated from the patient's home, the 8:30 negotiation a proposed tour plus a screen you can argue with.
01
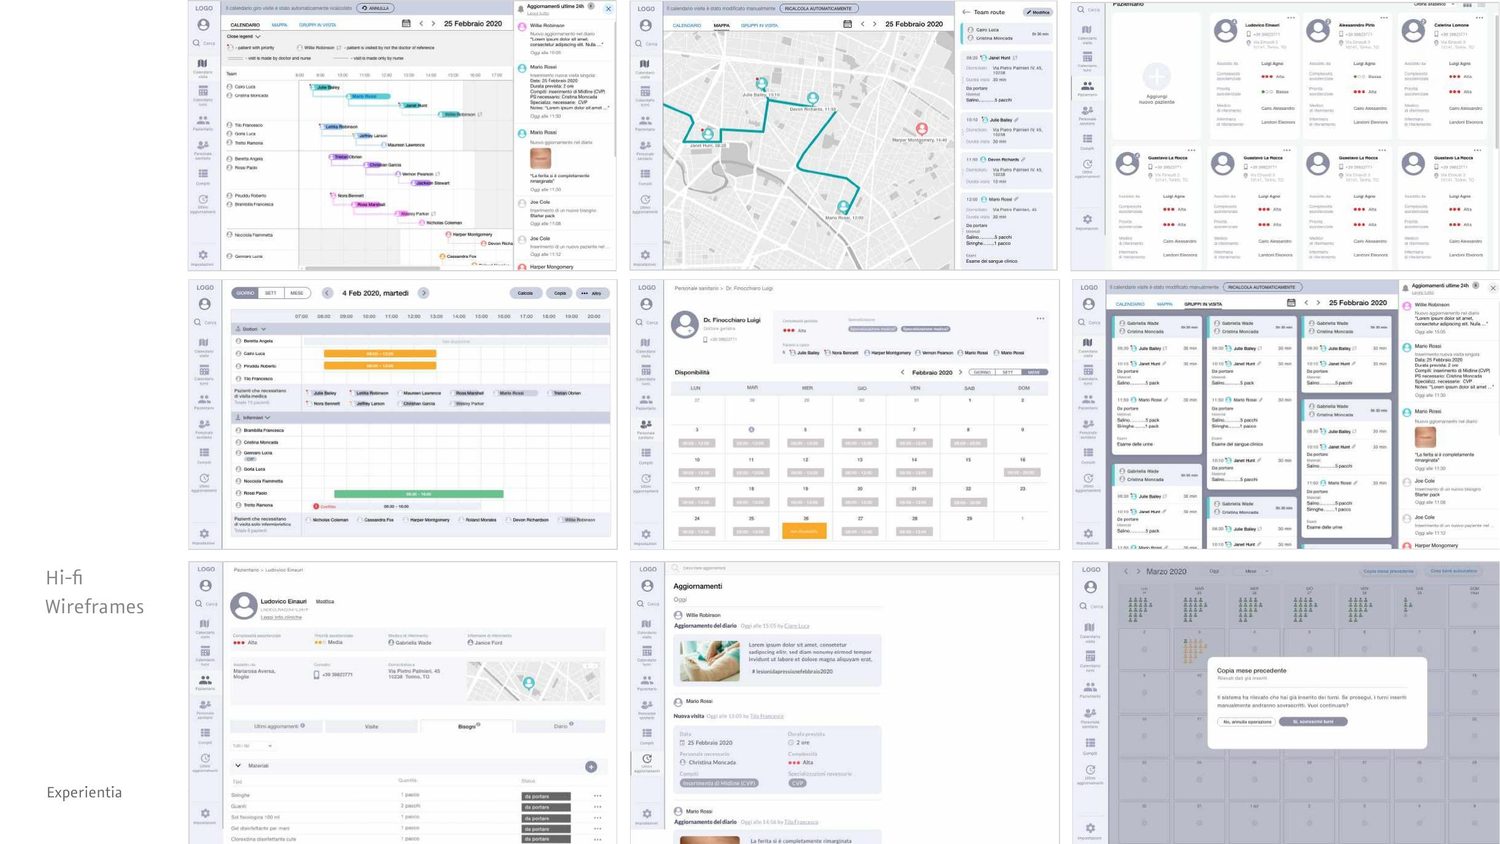
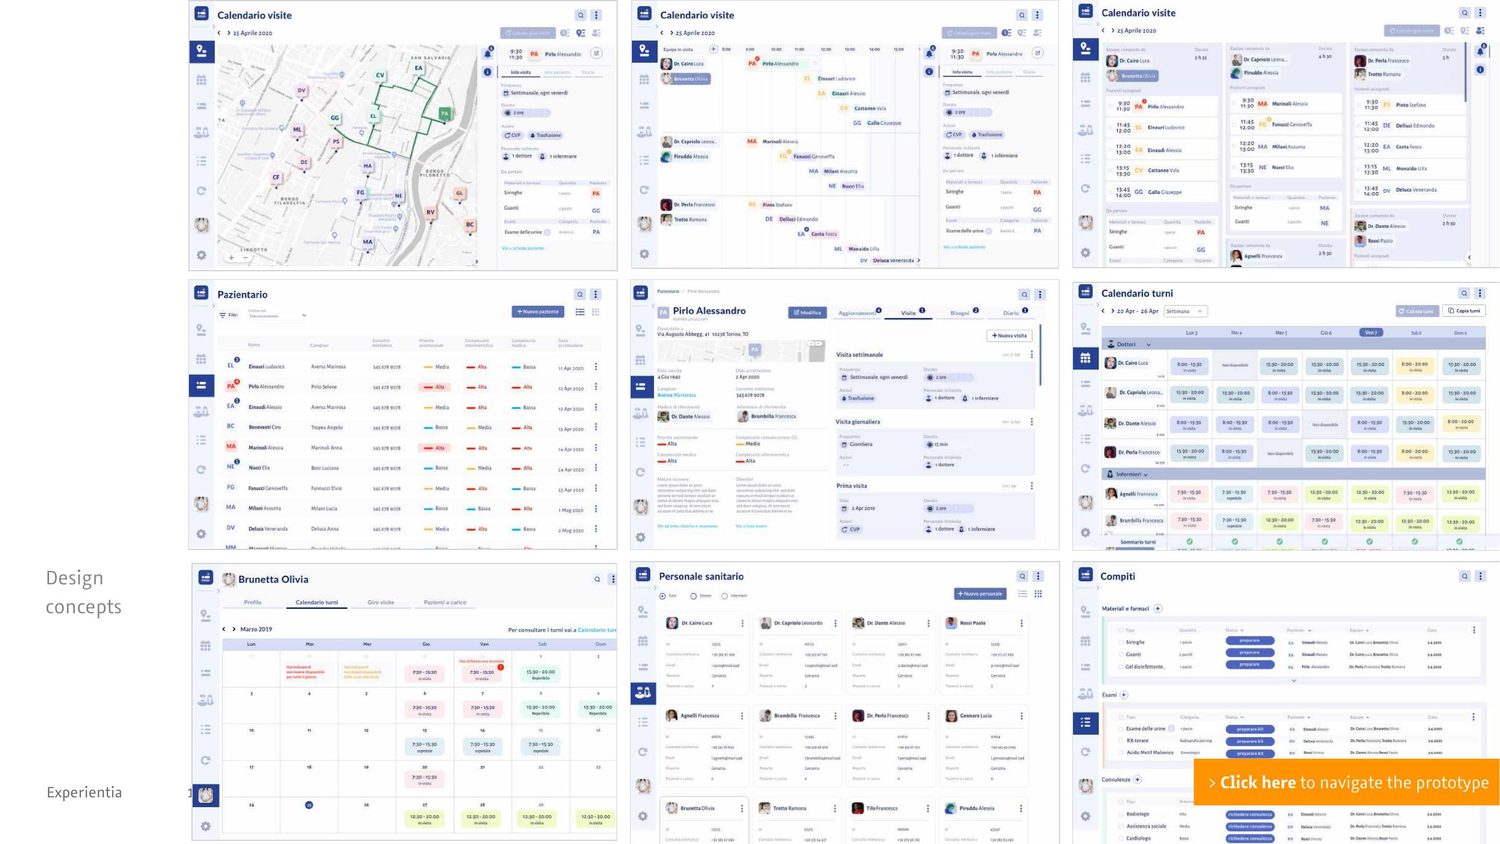
In the concept, an algorithm proposes the best possible visit tour by crossing staff availability and shifts with patient data: priority, clinical complexity, location and estimated visit duration. What we designed is the behaviour it should have — what it weighs, what it proposes, where a person overrides it — not the algorithm itself.
02
The proposal is not the decision. On an interactive whiteboard or display, office staff re-arrange teams and visits by drag and drop — together, in the room where the call gets made.
03
Staff update and share patient information simultaneously — from the office and from a patient's home — with a slice of it exposed to the caregiver, including when the staff is actually arriving.
Decision 01
The algorithm could have produced the schedule and been done with it. It doesn't: it proposes, and the staff re-arranges. In a clinical service the person carrying the responsibility has to keep the last word, and a tool that removes it gets worked around instead of used.
The trade-off: less automation, and a screen that has to make the variables legible enough to argue with.
Decision 02
Doctors and nurses in the office work on a desktop and an interactive whiteboard; the same people on a visit work on tablet and mobile; caregivers get their own mobile view. Same data, three different situations, three different designs.
The trade-off: more to design and maintain, against a single responsive interface that would have fitted none of the three properly.
Decision 03
The family's problem was not lack of clinical data, it was not knowing when someone would ring the doorbell. The caregiver's view was scoped to arrival, schedule and communication.
The trade-off: it doesn't answer every question a family has — but it answers the one they were phoning about.
The work closed on a click-through prototype with a UI design system, iterated on expert feedback, and delivered with the service blueprint, system map and information architecture behind it. It was presented as the WP4 output of the CANP project in April 2020 — a validated design, not a shipped product, and this page doesn't pretend otherwise.
This page is written in the plural because the work was. My own part, inside the team of three: I prepared the questions and the guide for the interviews and took part in them on site; I worked on the service blueprint; and I worked on the low-fidelity mockups and then on the UI of the high-fidelity prototype.