All projects

Ed-tech · Design challenge · 2020

LMS manager page

How does a manager keep track of a team's learning — and actually do something about it? A design challenge on a learning management system, scoped down to one use case and taken to a working prototype.

Type

Design challenge

Role

Solo — research to UI

Domain

Ed-tech, B2B SaaS

Output

Personas, journey, wireframes, hi-fi prototype

Year

2020

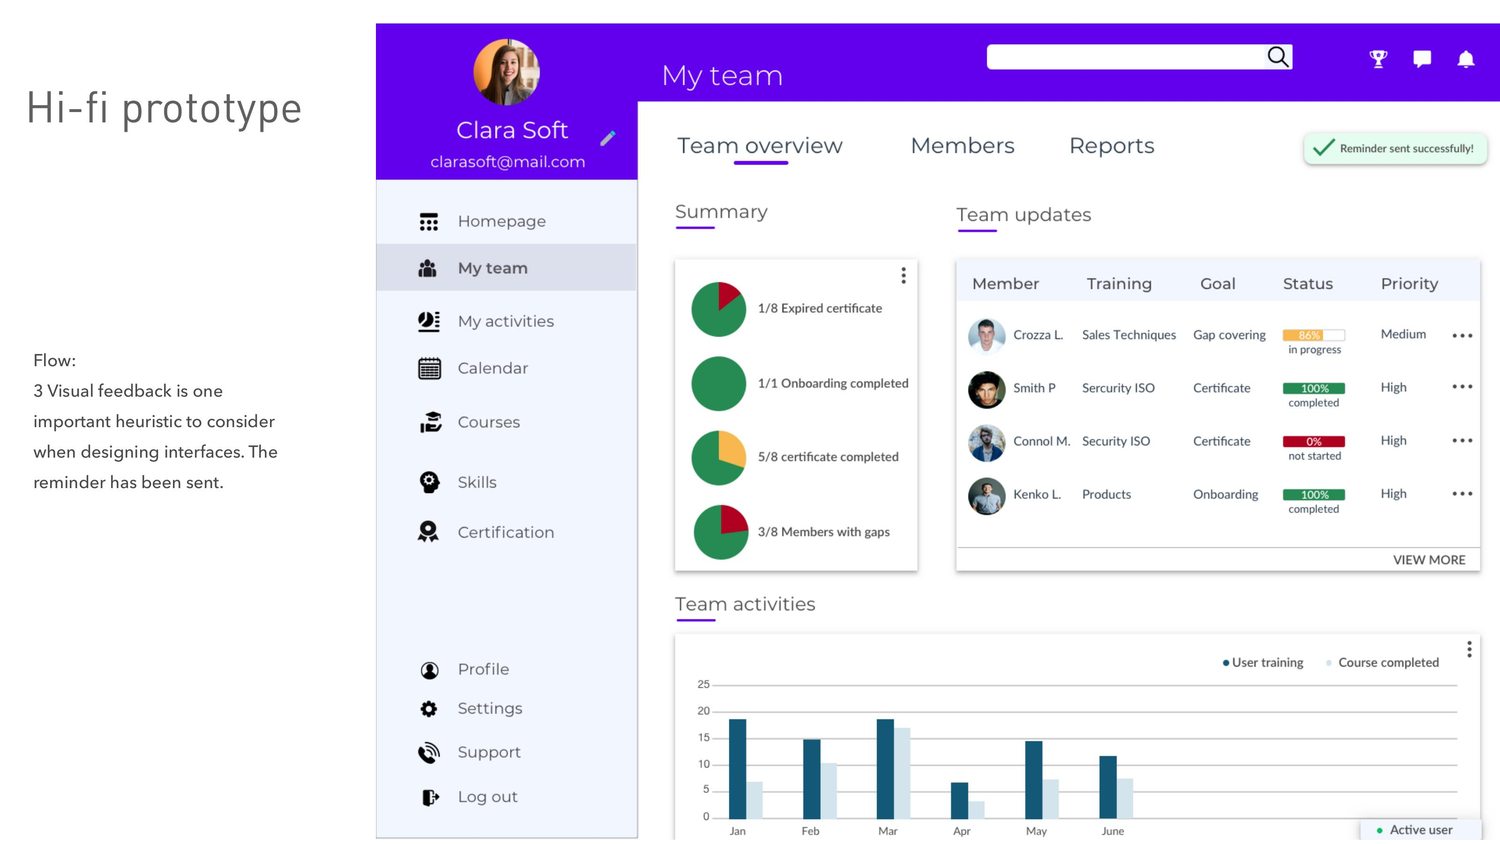
Hi-fi prototype of the manager page
The manager page: summary, team updates with status and priority, activity over time.

The brief

Design an engaging manager page inside a learning management system, where managers can check statistics and progress of their team's learning activities — and manage them.

Which is a brief with a trap in it. "Statistics and progress" describes a dashboard, and a dashboard is easy to fill and hard to make useful. The question I started from was different: what does a manager do after looking at the numbers?

Questions before answers

Before designing anything I wrote down what I didn't know. Who creates the content, and what happens if it's a third party? Which parameters does a manager actually need in a report, and what do they do with it afterwards? How do they find the right course for one specific person's skill gap? How do they hear about a certification that is about to expire? Where could automation genuinely save time rather than add a screen?

Most of those questions stayed open — the exercise had a deadline. But writing them down decided the scope: this page is not about reading data, it's about noticing something and acting on it.
Two managers

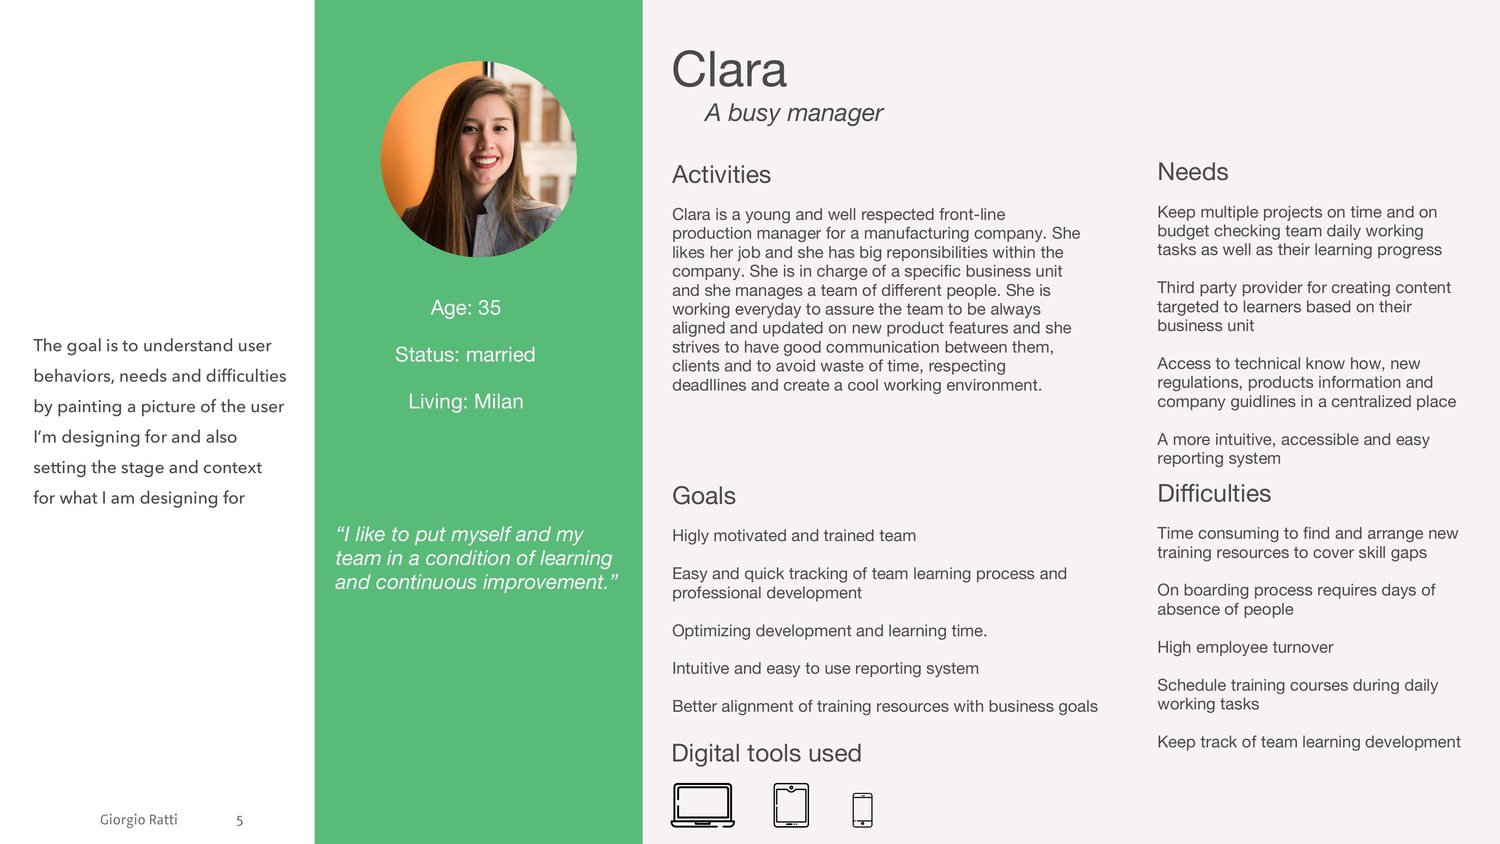
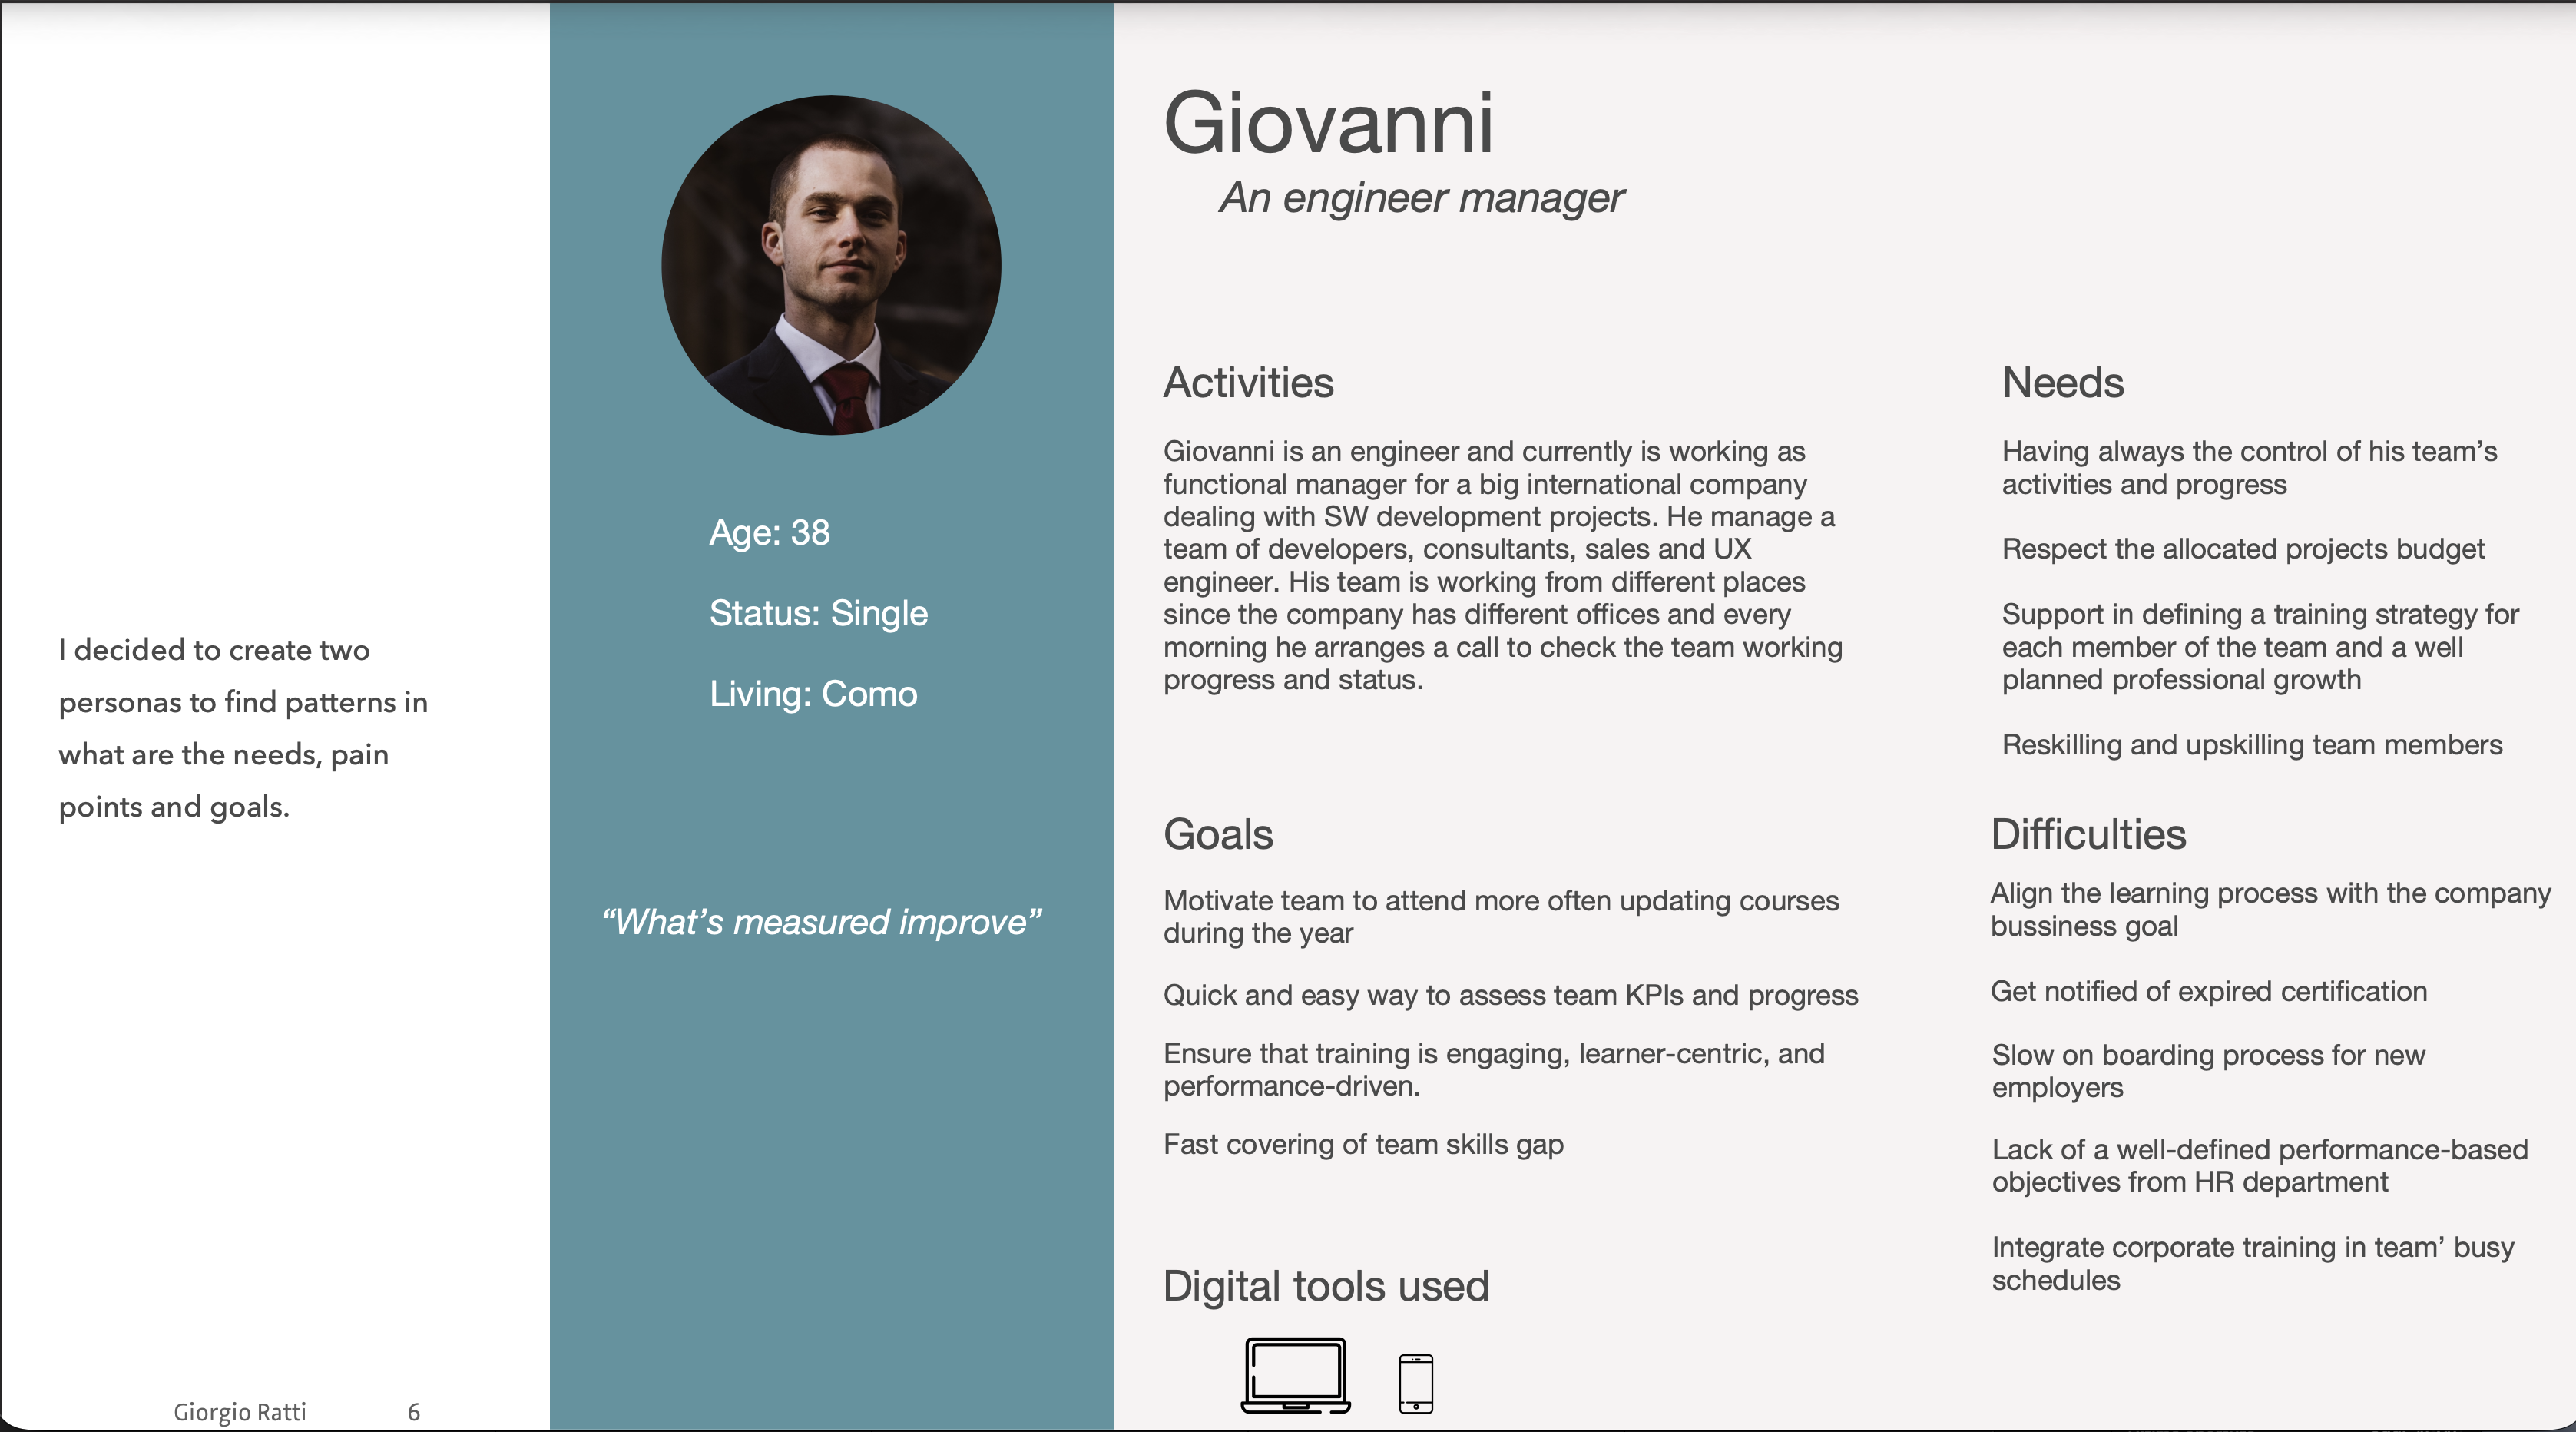
I built two personas rather than one, to see which needs were shared and which were specific: Clara, a front-line production manager in manufacturing, and Giovanni, an engineering manager in a distributed software company.

Persona: Clara, a busy manager
Clara, 35, front-line production manager: activities, goals, needs and difficulties. A second persona, Giovanni, covered the engineering side.

The overlap was the useful part. Both wanted the same three things: to know where the team stands without asking, to cover skill gaps quickly, and to stop losing days to an onboarding process nobody owns. Both said the same sentence in different words — "what's measured improves" for one, "I like to put myself and my team in a condition of continuous improvement" for the other.

The situation today

The scenario I designed against is a company with no e-learning system at all — which is the realistic starting point for the kind of organisation that buys one. New product features are announced by email or in a call. Training happens in classrooms and webinars, arranged case by case by managers and HR, sometimes with external trainers, in whichever room is free. Travel is booked by the back office. Recordings and documents end up scattered across a cloud drive. Every four months the manager writes a progress report, built from a survey emailed to each person plus a short interview.

The problems follow from the process, not from anyone's incompetence:

  • communication gets lost or arrives late
  • training means days of absence — three, for the certification in my use case
  • manager, HR and back office spend time coordinating with each other
  • files live in several places and are hard to find
  • logistics cost real money
  • documentation goes out of date faster than anyone updates it

Needs, goals, assumptions, constraints

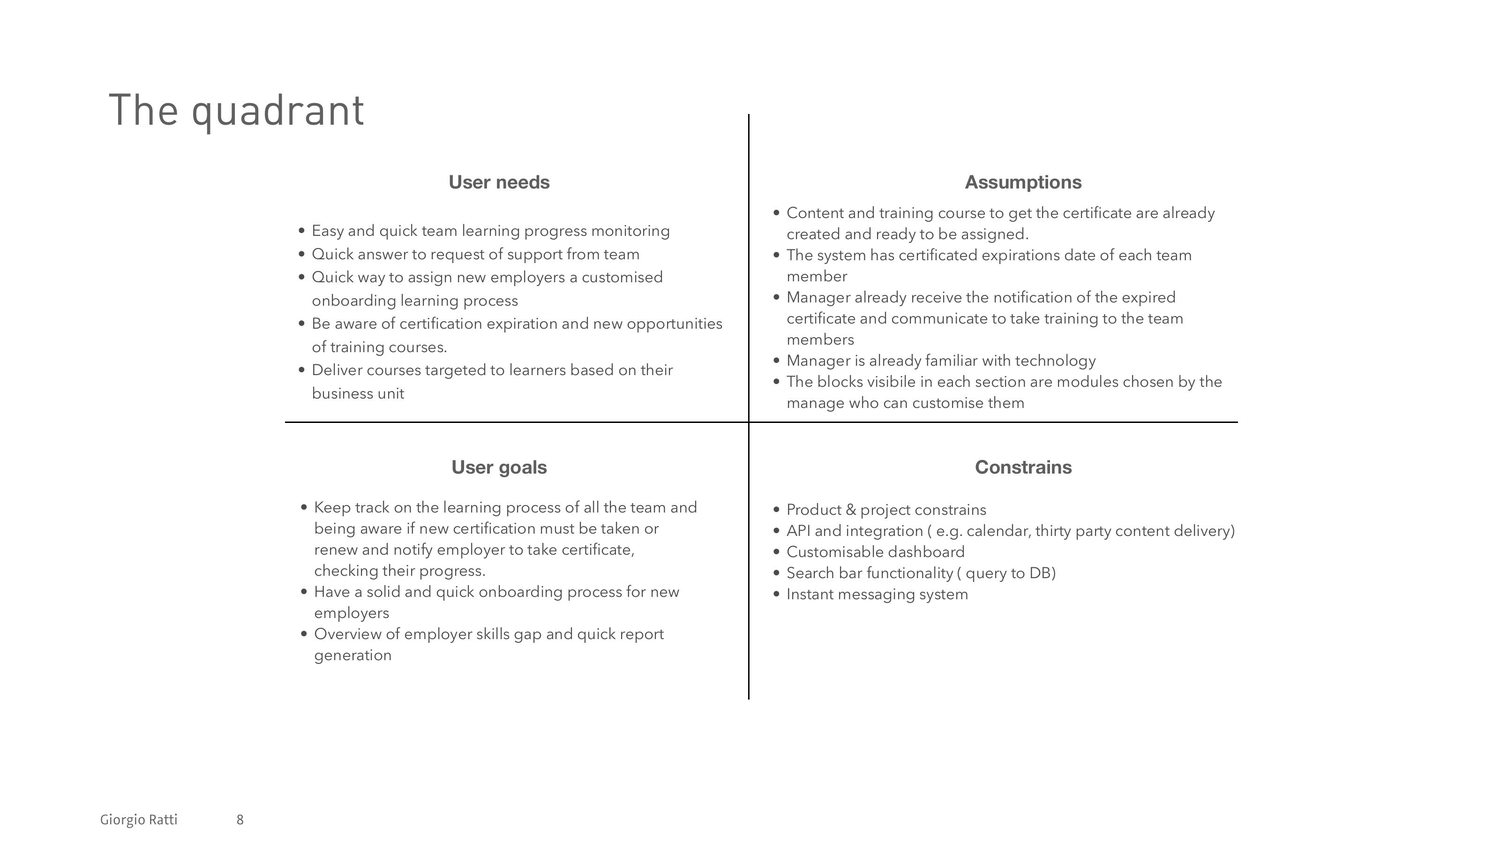
I used a four-quadrant sheet, and the quadrant that mattered most was assumptions. Listing what I was taking for granted — that the courses already exist, that the system knows each certificate's expiry date, that the manager is comfortable with software — kept the design honest about what it depends on.

Four quadrants: user needs, user goals, assumptions, constraints
User needs and goals on one side, assumptions and constraints on the other.

A week in the manager's life

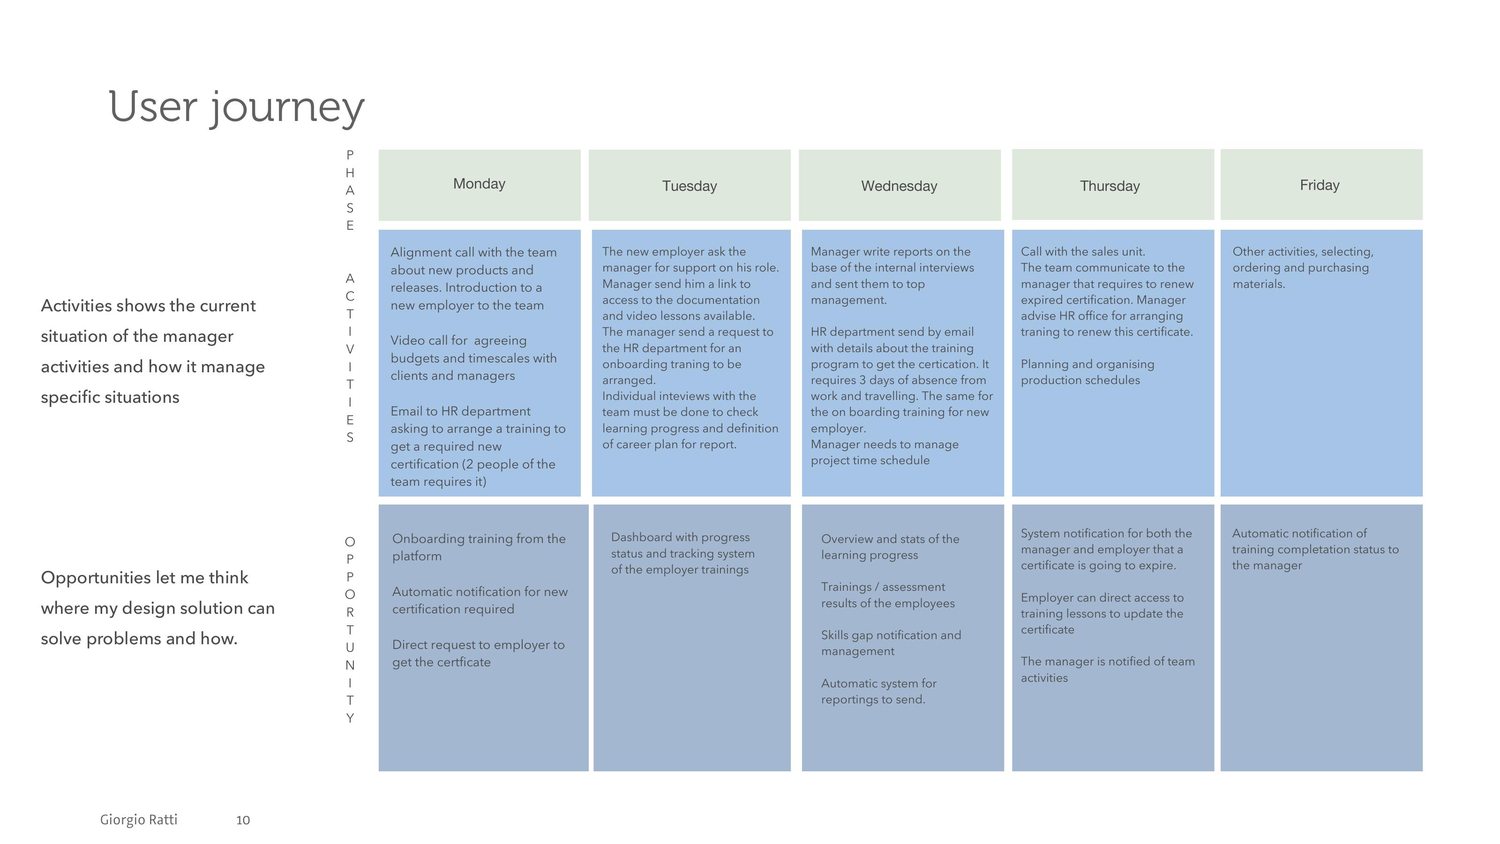
Mapping the current journey across five days showed where the tool could earn its place — and where it would just be another tab.

Current user journey across a week, with opportunities
Phases, activities and opportunities, Monday to Friday. The bottom row is where the design solution enters.

The week is mostly other things: alignment calls, budget conversations with clients, production schedules, purchasing. Learning management is what the manager does in the gaps — an email to HR asking to arrange a certification, a link sent to a new joiner who needs documentation, interviews to prepare a report. That framing set the bar: whatever I designed had to be usable in two minutes between two meetings.

Decisions

Decision 01

One use case, taken all the way

Instead of sketching the whole product shallowly, I picked a single situation and designed it properly: two team members with an expired certification — tracking their progress and sending a reminder to renew.

The trade-off: the rest of the product stays undesigned. In exchange, one flow is complete enough to be judged, including the confirmation state.

Decision 02

Statistics are not the point; the next action is

The brief asked for statistics. The page shows them — expired certificates, gaps, onboarding, completion — but every row in the team table carries a menu: push reminder, assign new training, change priority, send email. Data that can't be acted on from where you read it sends the manager back to email.

The trade-off: more states and permissions to design, and a page that can get busy if the actions aren't kept few.

Decision 03

Skip the information architecture, and say so

Wireframes normally come after an information architecture and a system map. With the time available I went straight to the page that lets the manager reach the goal, and wrote down that I had skipped a step rather than pretending the order was intentional.

The trade-off: the navigation around the page is plausible rather than derived. It's the first thing I'd redo with more time.

Wireframes

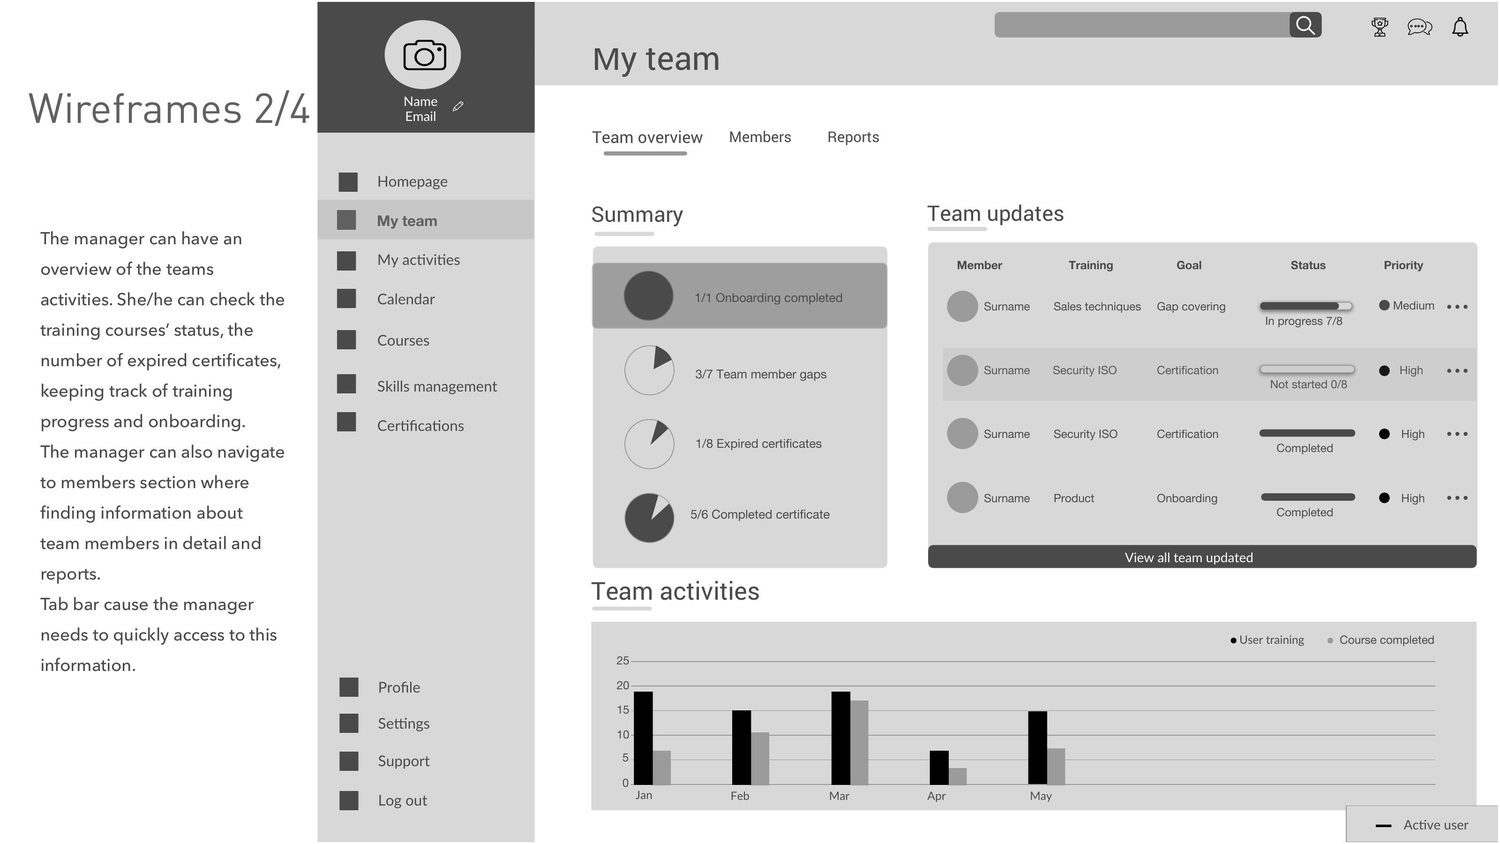
Three blocks: a summary of what needs attention, a team table with status and priority, and activity over time. Tabs for overview, members and reports, because a manager needs to switch between them quickly.

Wireframe of the manager page
Summary, team updates, team activities — plus the row menu that turns a status into an action.

The flow, in four steps

01

Notice

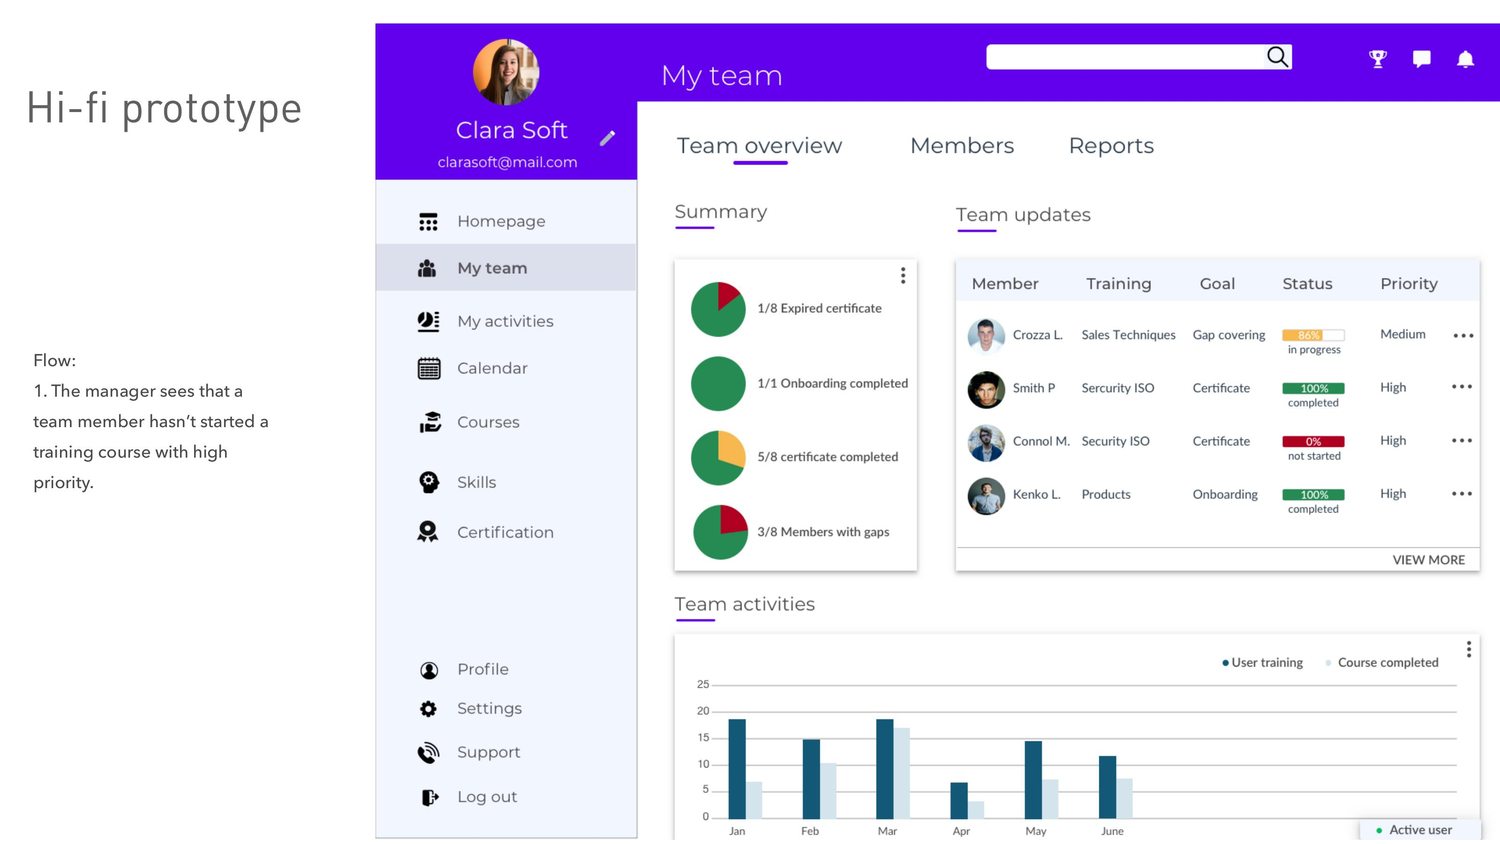
The manager sees a team member who hasn't started a high-priority course: 0%, not started, marked high.

02

Act

From the same row, push a reminder — or send an email, change the priority, assign a different training.

03

Confirm

A visual confirmation that the reminder was sent. Cheap to design, and the difference between trusting the tool and checking twice.

04

Stay informed

Notifications for completed courses, expired certificates and newly available training.

Confirmation that the reminder was sent
Step three: the reminder has been sent, and the interface says so.

Visual direction

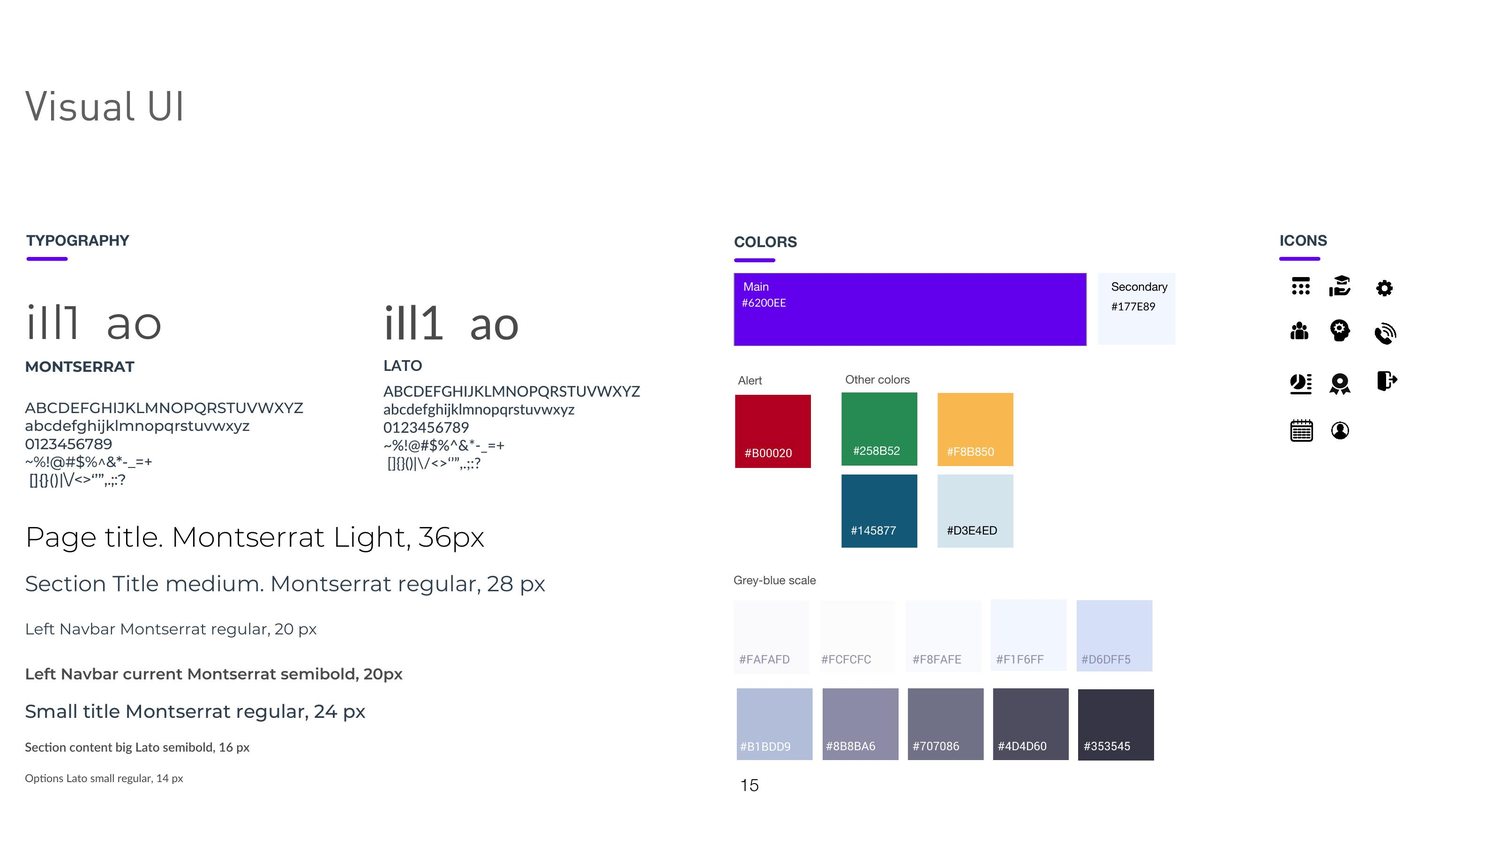
A small design system, following material design guidelines: Montserrat for headings and Lato for content, a defined palette with a single strong primary, a semantic set for status — green for completed, amber for in progress, red for not started or expired — and the icons the page needed.

The status colours are doing real work here: on a page whose job is to show what needs attention, colour is the fastest read there is.

Typography, colour palette and icons
Typography, palette and icons.

What was missing

My own conclusion at the time, and I'd still sign it: the solution has plenty of margin for improvement, and most of it isn't design work. It needs an overview of the whole system, real data instead of assumed data, and a technical feasibility check on the parts I treated as given — the integrations with calendar and third-party content, the customisable dashboard, the messaging.

What I'd defend is the process: research first, then explicit needs and assumptions, then sketches, wireframes, and only at the end a visual. What I'd change is the order I broke — the information architecture should have come before the page.